A Gentle Introduction to Social Network Analysis - ppt video online download
The Structure of Relationships Relationships as the unit of analysis, but not as isolated units: their interconnection, their collective structure
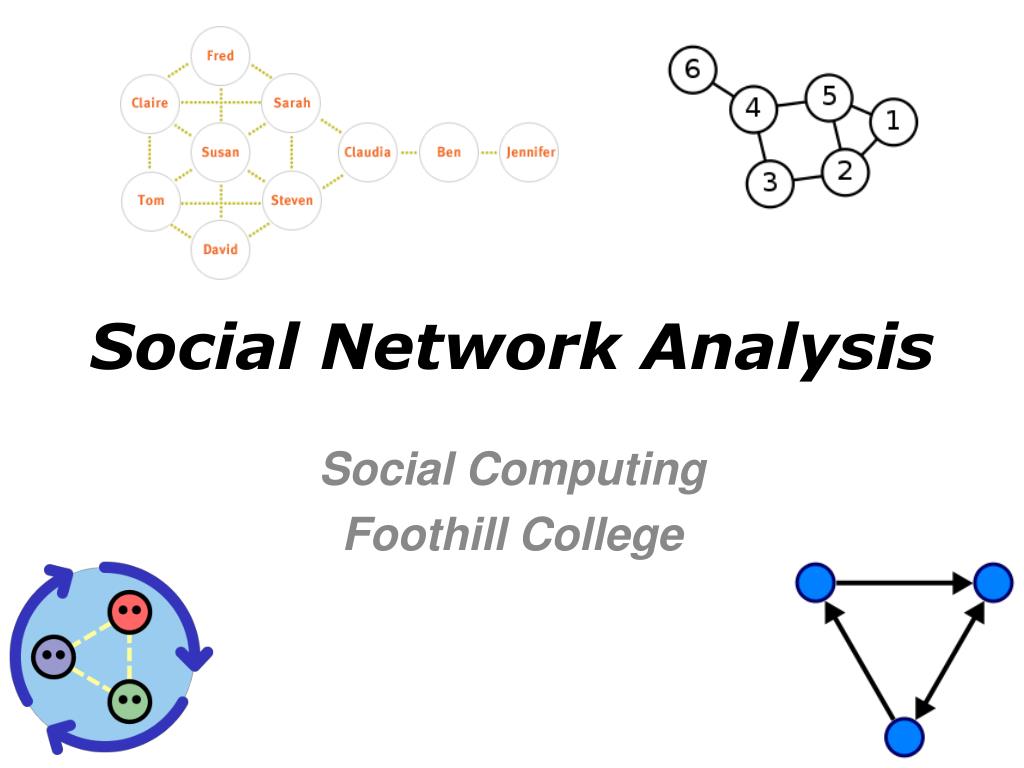
A Gentle Introduction to Social Network Analysis
From a Sociologist’s Perspective. Reuben (Jack) Thomas April
Relationships as the unit of analysis, but not as isolated units: their interconnection, their collective structure.
Nodes (Vertices) indicate social entities that form the relationships.
Friendships. Enemies. Sexual Encounters. Murders. Joke Telling. Collaborations. Co-sponsorship. Co-attendance. Lending a hand. People. Places. Boats. Organizations. Social Movements. Works of Art. Events. Dogs. Countries. Schools of Thought. Memes.
Multiplex: multiple types\roles\exchanges\etc in the relationship (vs Simplex) Directed vs Undirected. Other variables about the relationship.
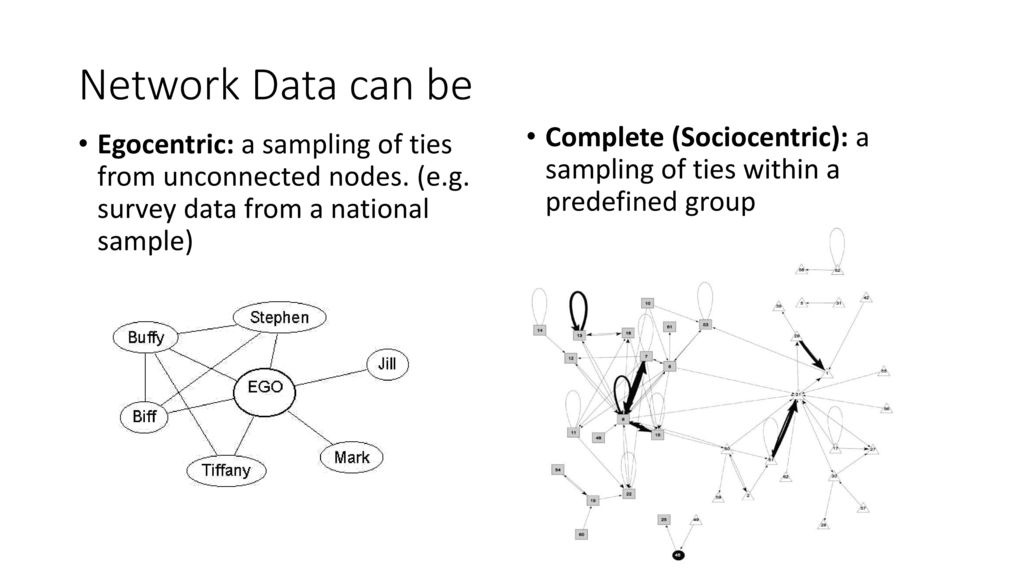
Egocentric: a sampling of ties from unconnected nodes. (e.g. survey data from a national sample)
Maria Weiwei 1. Weiwei Maria 1.
Bob Maria Weiwei. Bob Maria Weiwei
Karate Spanish Swim. Bob Maria Weiwei
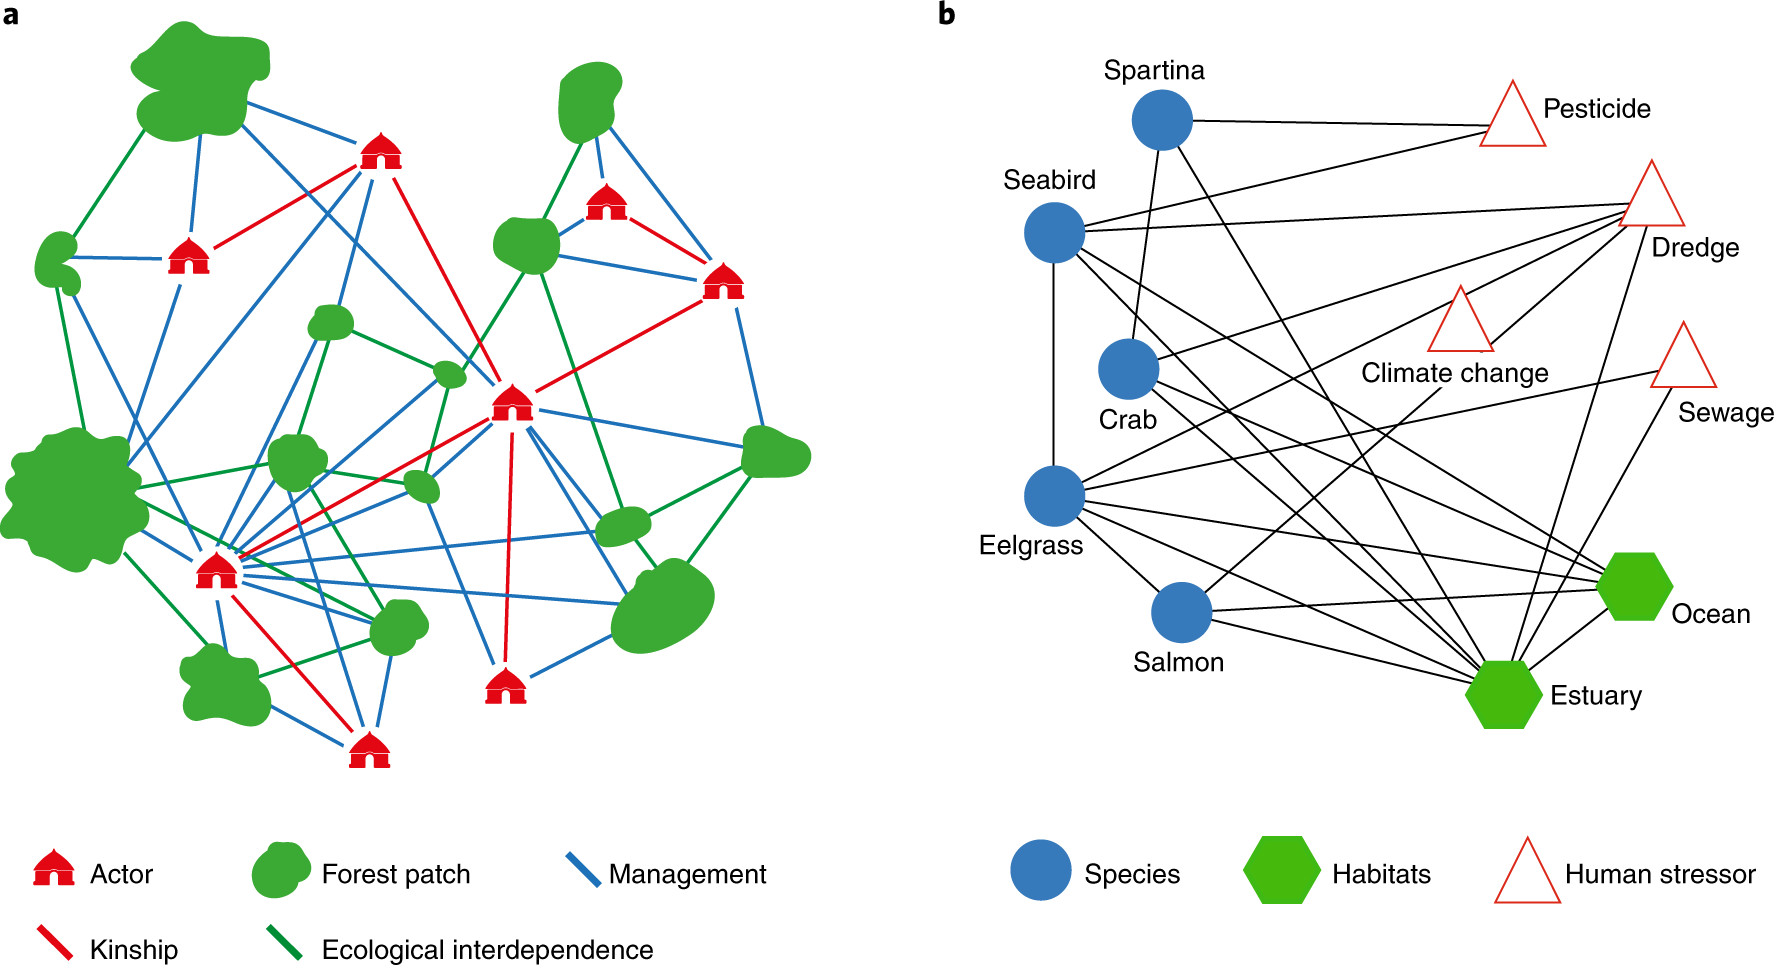
Multi-Mode Networks People and Groups Corporations and Governments Scientists and Papers and Journals and Disciplines Ships and Captains and Ports
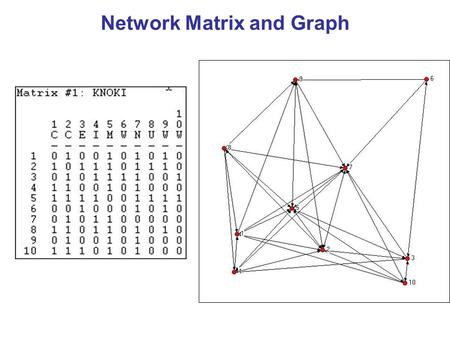
Social Network Visualization
Number of Ties / Number of Possible Ties. Density = 2(Edges) / Nodes(Nodes-1)
The Diameter of a network is the length of its longest Geodesic. Reachability or Connectedness: Can every node reach every other node All geodesics are1 in perfectly dense networks.
Centrality How central is a node to the network, or how peripheral
Degree-Centrality Having a lot of connections This is just the number of ties a node has In-degree vs Out- degree in directed networks
Having a lot of connections to people who have a lot of connections to people who (recursive) Google’s PageRank is based on this idea.
Being close to everyone in the network. The Farness of a node is the average distance to all other nodes in the network The Closeness of a node is the inverse of its Farness
Being between a lot of people in the network. Being on many geodesics. The Betweenness of a node is the proportion of all the geodesics in the network that the node is a part of.
My friends are friends Transitivity. Triangle completion rate. The Clustering Coefficient: Actual links between alters / Possible links between alters. Actual triangles / Possible triangles.
Lack of diamond-clustering can create spanning trees in hetero-sexual networks
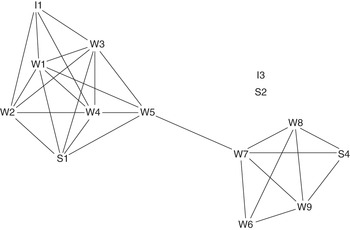
Cliques, the Idea: sub-sets of the network in which nodes are more closely\strongly tied to each other. Formal definitions vary. A Maximal Clique is as big as possible while remaining perfectly dense. Less strict Clique definitions can be tricky (N-Cliques, N-Clans)
N-Cliques: All members must be mutually reachable at distance N. N-Clans: …but only through other members K-Cores: subgraphs within which all nodes have at least K ties (e.g. in a 4-core all nodes have at least 4 ties within it) Also see K-plexes, F-Groups, etc.
The minimum number of actors you need to remove to break the network in two. You can talk about K-edge-connected vs K-vertex-connected. K-cutsets: the cliques formed by cutting K nodes/edges out.
Remove edges that are the most between to reveal nested networks.
Are ties disproportionately between similar nodes Can refer to any characteristic, not just groups: age, centrality, GPA, GDP, delinquency, height, hygiene, etc.
same ties to same nodes. Automorphic Equivalence. indistinguishable structural position (but maybe not same alters) Regular Equivalence. connected to equivalent alters (but maybe not same number of alters)
Approaches vary by discipline, a lot. in Sociology, ERGMS and SENIA are popular now, QAP models used to be.
Or, Why can’t I just use dyadic data in a regular regression Answer: Auto-correlation, big time Solution: randomly switch who is tied to whom in the data many many times, re-estimating the model each time, to create an unbiased distribution of possible samples for calculating the standard errors. Appropriate when your cases are dyads within a network, and your dependent variable is information about the dyad.
Or, Can’t we just run a logit on this The goal is to calculate the odds of a tie, controlling for aspects of network structure and dyadic variables. (earlier versions were called p* models)
The cutting edge of SNA is all about modeling dynamic change in networks.
Similar to ERGMs, but specifically developed for dynamic network data. I don’t really know it, ask Dan Ragan and Brian Soller.
NodeXL: The easiest visualization tool I’ve used, but 1) it only works with Microsoft Excel in Windows, and 2) it is no longer free for advanced features. Also calculates some metrics. Gephi: Another nice visualization tool, works with Macs, Linux and Windows alike, and its open source. Pajek: Once the favorite visualization tool in SNA, and still popular SoNIA: a visualization software package for dynamic data (network movies!)
statnet: for Exponential Random Graphs (ERGMs), by UW-Seattle. igraph: nice visualization tools, also in Python and C\C++ sna: a package of various SNA tools developed by Carter Butts at UC-Irvine. RSiena: just like it sounds, run SIENA models in R.
David Easley & Jon Kleinberg’s Networks, Crowds, and Markets: Reasoning About a Highly Connected World. Duncan Watts’s Six Degrees: The Science of a Connected Age. Stanley Wasserman & Katherine Faust’s Social Network Analysis: Methods and Applications (this is more of a reference book) (find these slides on my website

A Gentle Introduction to Social Network Analysis - ppt video online download

A Gentle Introduction to Social Network Analysis - ppt video online download

A Gentle Introduction to Social Network Analysis - ppt video online download

A Gentle Introduction to Social Network Analysis - ppt video online download

Introduction in Social Network Analysis - ppt download
PPT - Social Network Analysis PowerPoint Presentation, free download - ID:1688759

A Gentle Introduction to Social Network Analysis - ppt video online download

A Gentle Introduction to Social Network Analysis - ppt video online download
Introduction to Social Network Analysis

Introduction to Social Network Analysis [3/5]: Historical Applications
A Gentle Introduction to Social Network Analysis - ppt video online download